

Real-Time Spend Visibility at Your Fingertips — BlueBean Spending Dashboard
Track every purchase. Spot anomalies instantly. Empower teams with transparent, real-time spend visibility—without the complexity of legacy expense platforms.
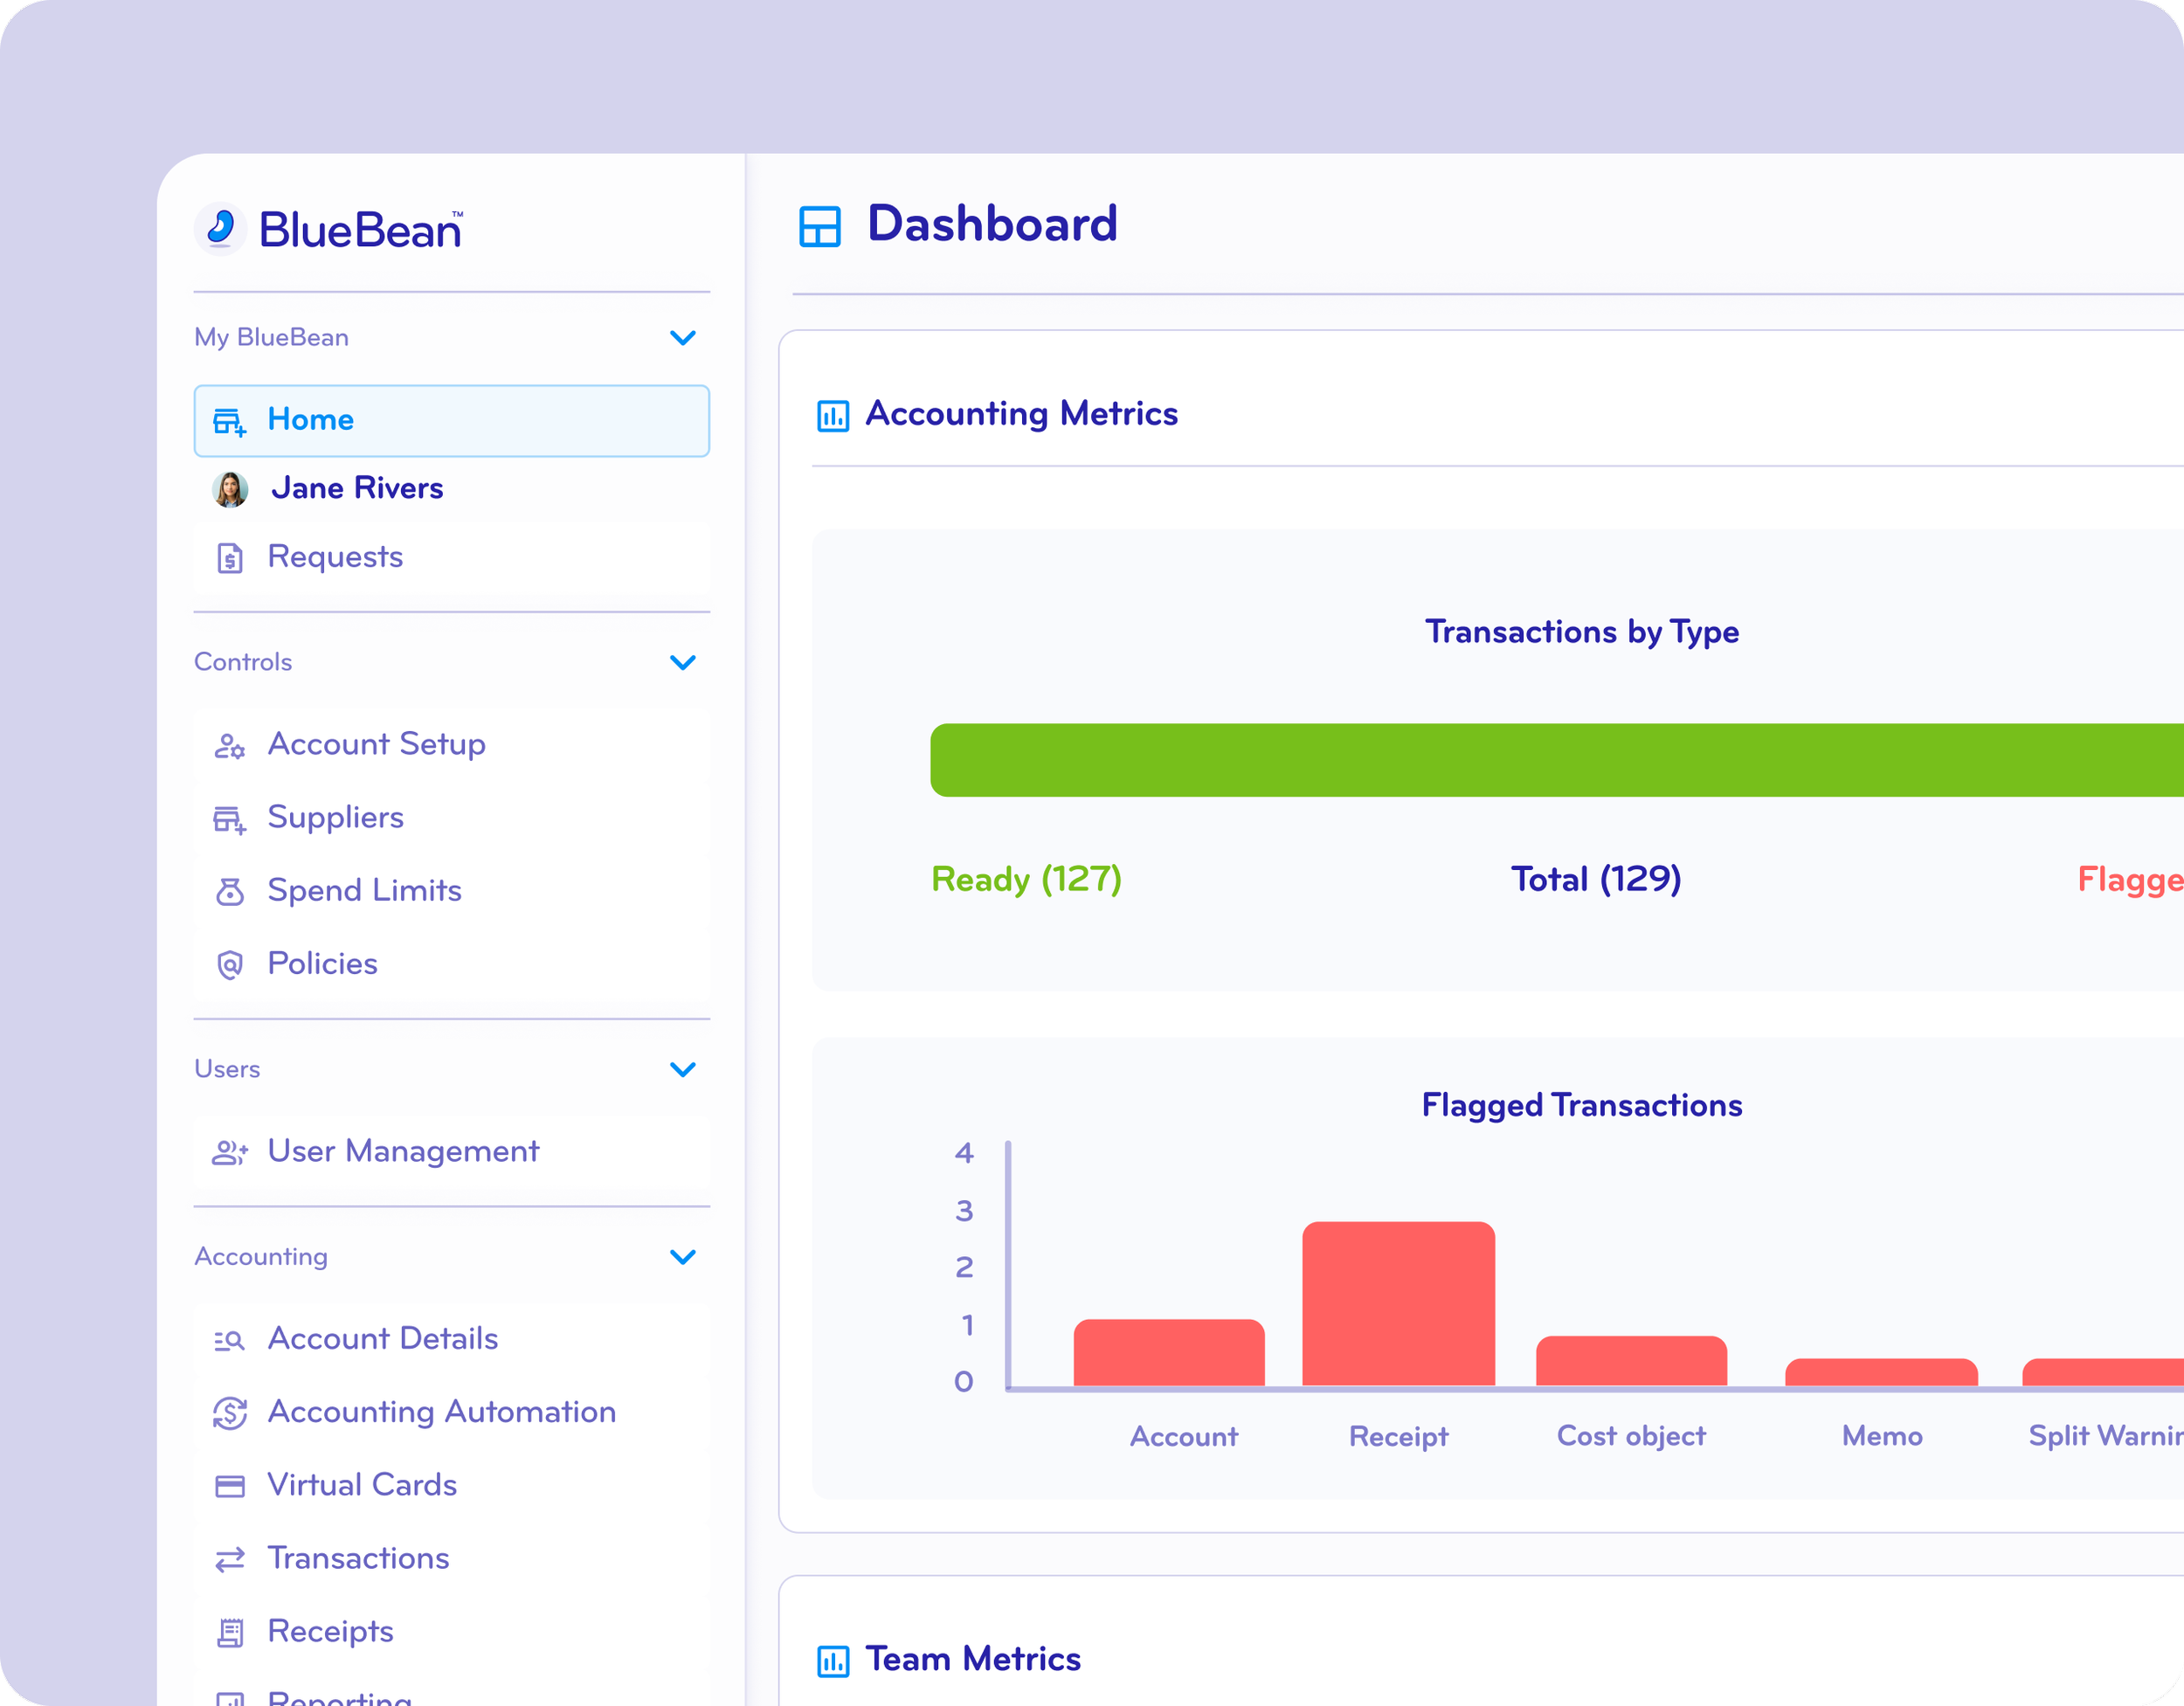
Gain Granular Spend Visibility Across Your Entire Organization
BlueBean’s Spending Dashboard gives finance and accounting teams a single source of truth for all employee and vendor spending.
With BlueBean, you can:
View all corporate and employee spend in one centralized dashboard
Track spending by employee, team, vendor, category, or card program
See real-time updates from all connected cards (virtual and physical)
Eliminate end-of-month surprises with live budget tracking
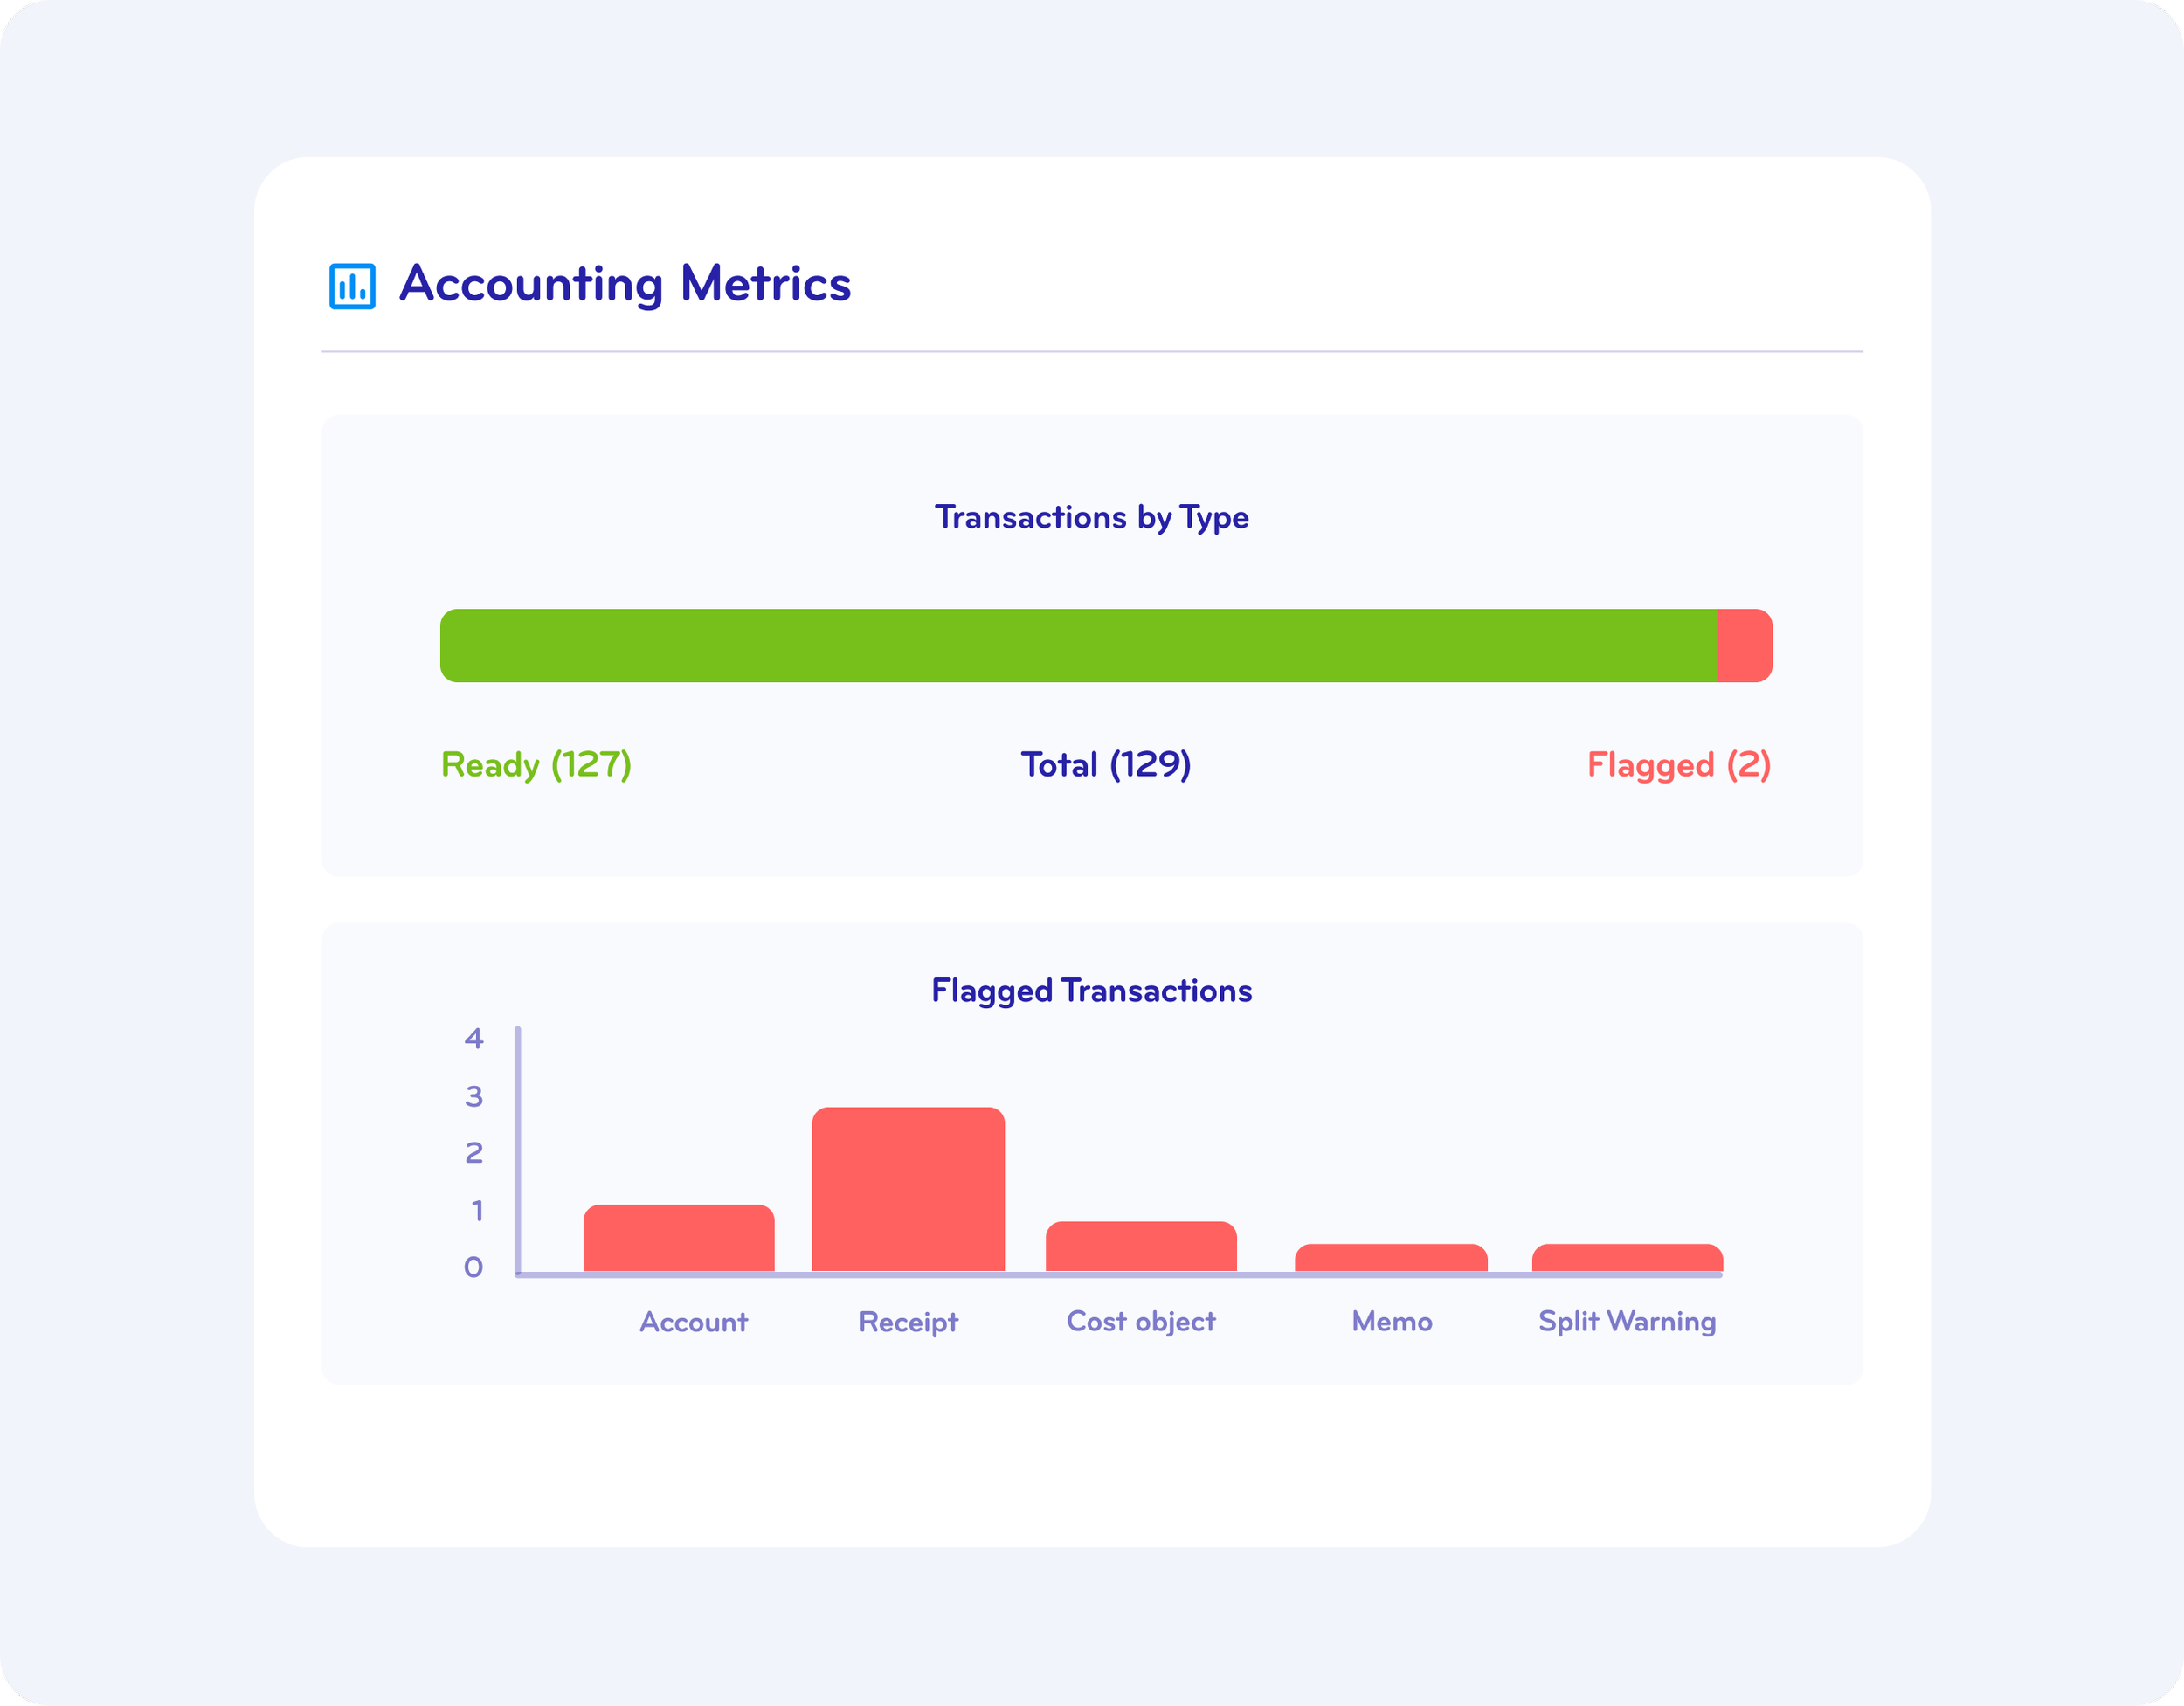
Identify non-compliant transactions the moment they happen
Built for speed and clarity, the dashboard updates instantly so you always know exactly where money is going.
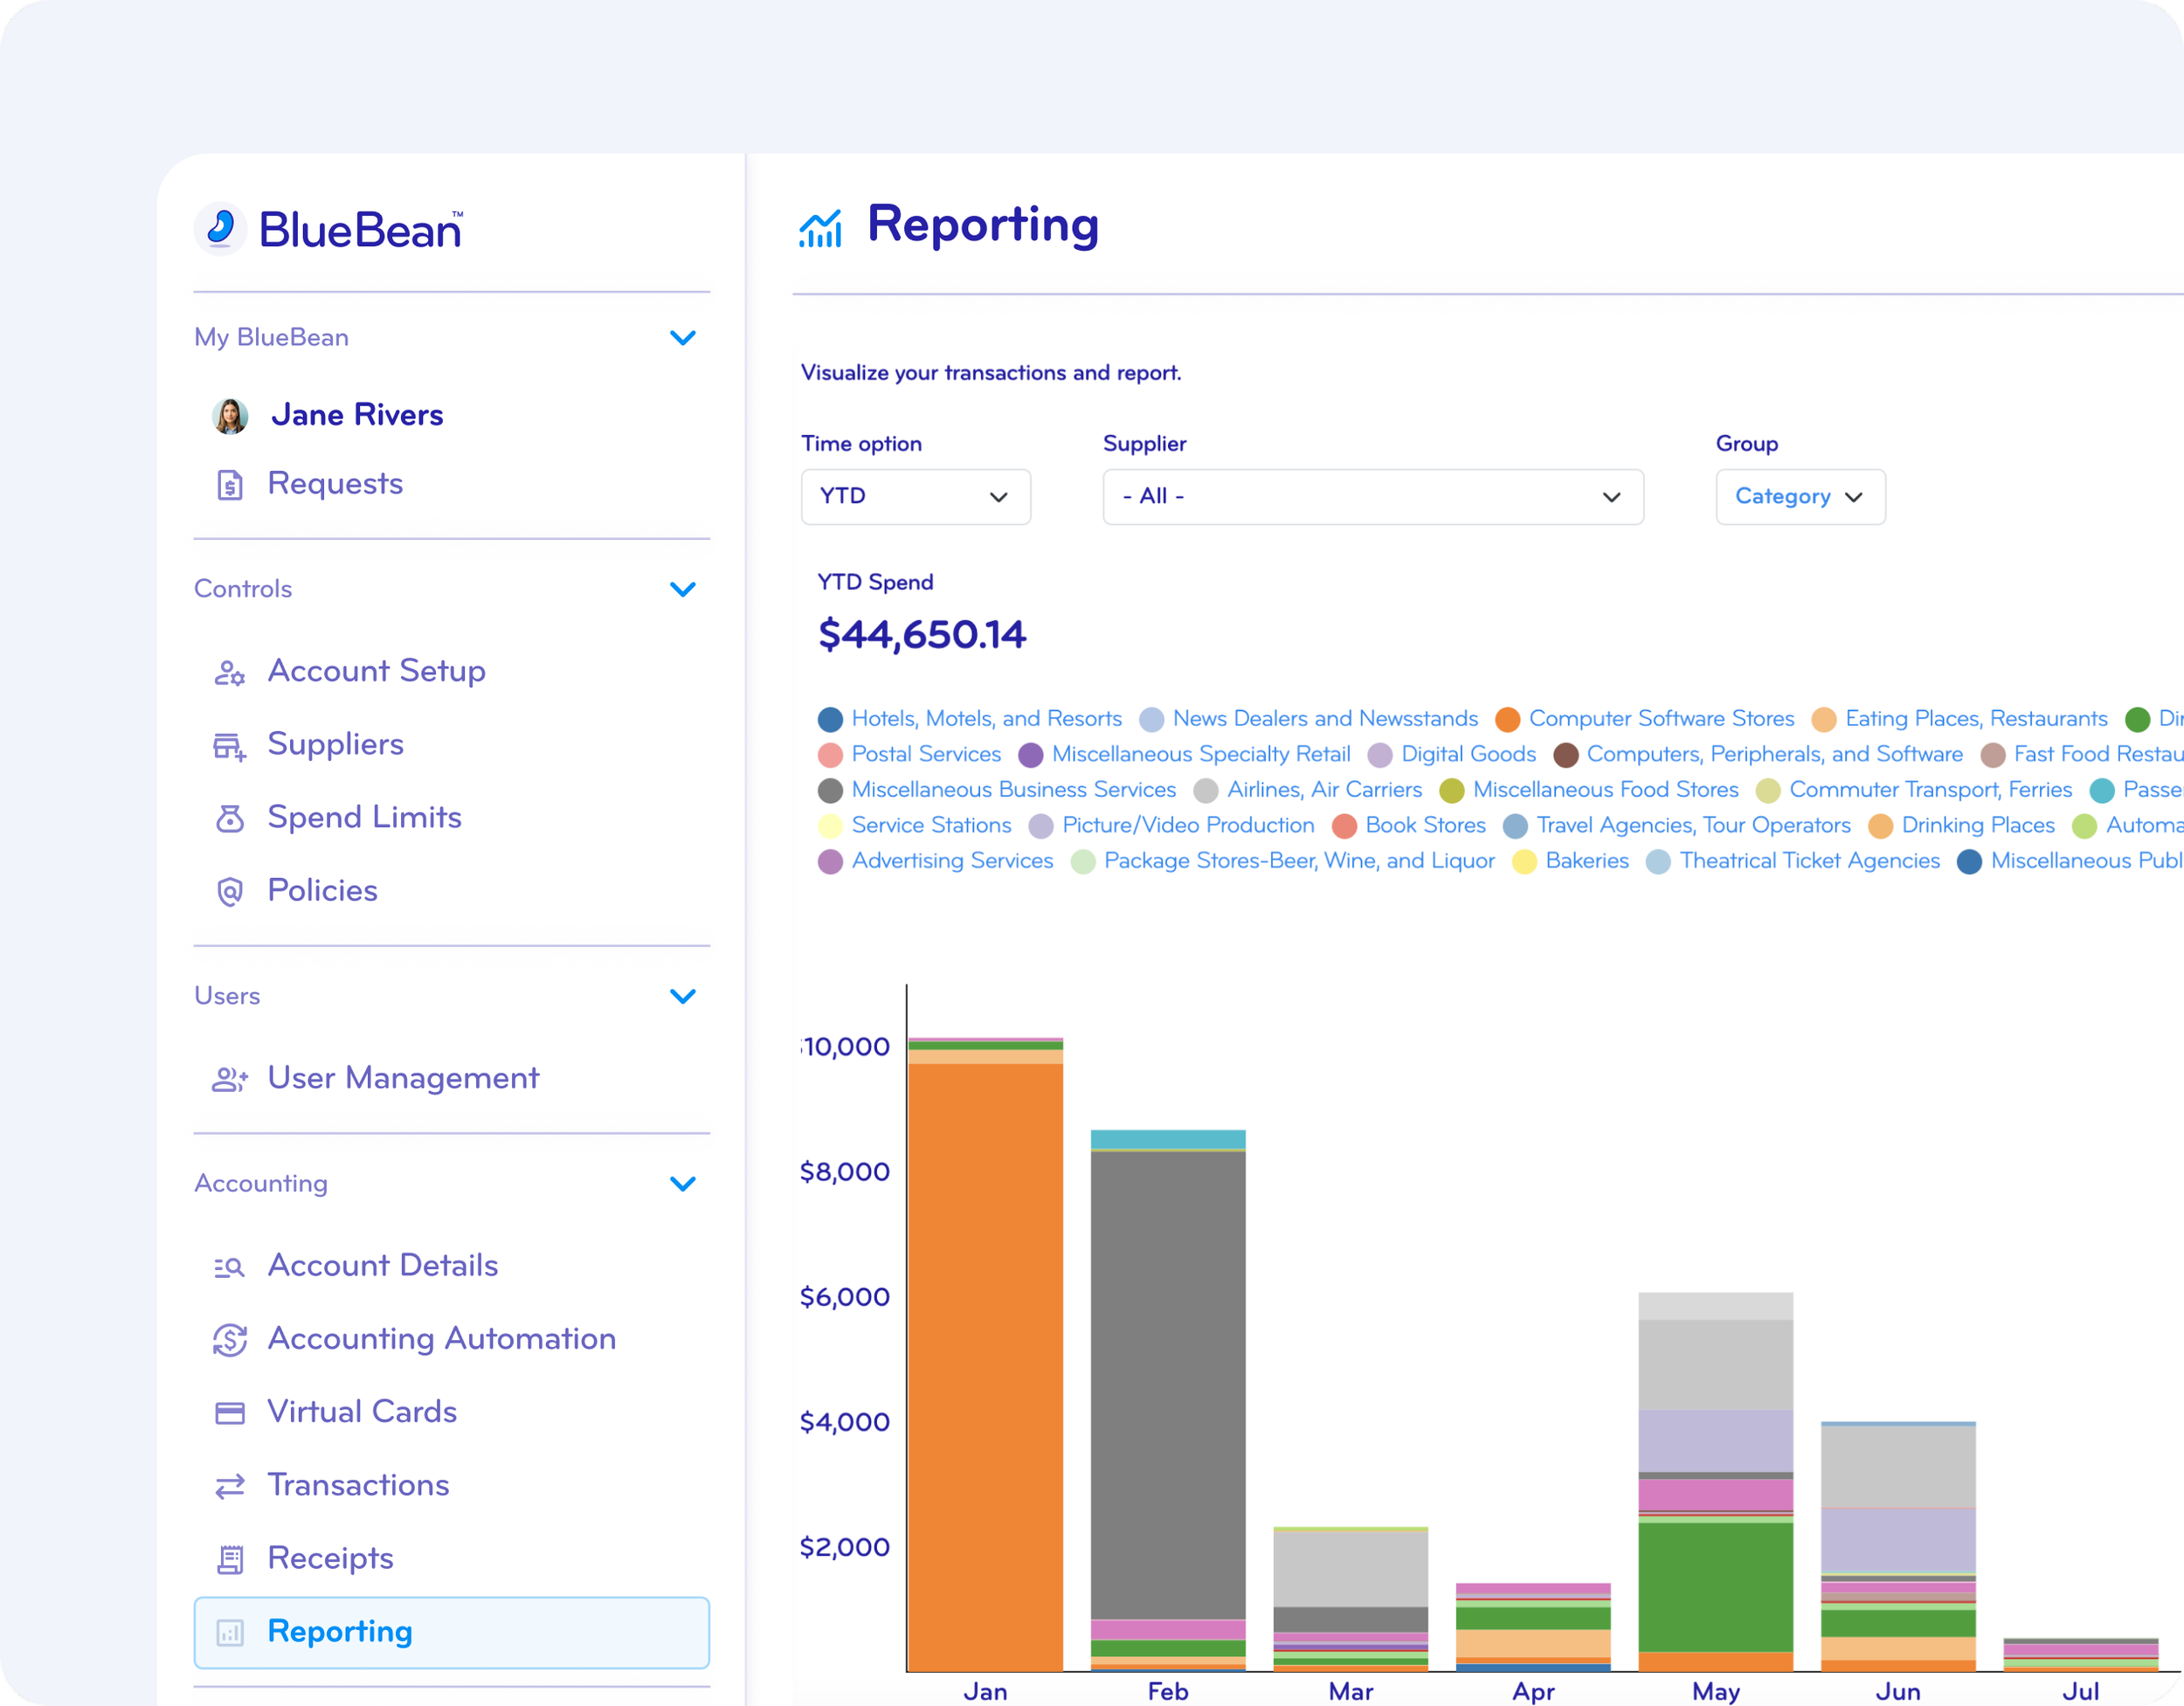
Drill Down into Spend Data for Surgical Analysis
Move from high-level trends to transaction-level detail in seconds.
BlueBean enables deep, intuitive analysis:
Click into any department or vendor for itemized spend
Filter by date ranges, budget owners, merchant category codes, G/L accounts, or cost centers
Surface unusual transactions using built-in anomaly detection
Review attached receipts automatically captured at payment
Understand spend patterns that impact cash flow and forecasting
BlueBean gives finance leaders “x-ray vision” into spend—without complex BI tools or manual spreadsheets.
Export Reports and Data Instantly in Any Format
Share insights with stakeholders or integrate directly into your accounting workflows.
Export options include:
CSV, PDF, XLSX
Pre-built templates for month-end and audit reports
Configurable data slices (transactions only, card activity, GL-coded exports, receipt bundles)
Exports are optimized for accounting teams—clean, structured, and ready for import into systems like NetSuite, QuickBooks, Xero, or Sage.
Customize Dashboards and Make Insights Accessible to Everyone
Every business tracks spend differently—so BlueBean tailored dashboards for each role.
Customizations include:
Role-based views for admins, approvers, and basic users
Alerts for budget thresholds, suspicious transactions, or unapproved behavior
Permissions and access controls to ensure the right data reaches the right people
Give every team member the visibility they need without exposing sensitive financial information.

See Your Spend More Clearly Within Minutes
Start a free trial or book a demo to understand how BlueBean delivers real-time clarity without legacy complexity.